
Exceptional Technology: ERS’s Alpha Algorithmics 22™ (AA 22™)
ERS’s innovative AA 22™ technology has been engineered to produce extraordinary investment results. Our AA 22™ model consistently identifies high-performing stocks, providing your firm with tremendous marketing power and increased profitability.
Don’t take our word for it – the proof is in the performance. Below, explore seven comprehensive studies where AA 22’s™ selections have significantly outperformed the S&P 500, underscoring a track record of exceptional returns. With ERS’s technology, we can help you catapult your firm from ordinary and common to extraordinary and extraordinarily profitable. With these returns, you won’t be charging them just 1%.
Start on your journey of incorporating data science into your practice with ERS. With success, you will be able to charge more than 1%. Simons’ hedge fund charged 5% and 45%. Raise your goals and raise your standards. ERS’s success depends upon our ability to help you achieve your goals.
Shattering Market Myths: The Medallion Fund Success Story
and the Fallacy of Market Efficiency
Grow My RIA – The Fastest & Surest Way Is By Growing Your AUM
Equity Risk Sciences is your data science AUM growth accelerator.
Win The Competition For Clients
You are competing against over 15,000 RIAs and 350,000 financial advisors. You need a strategy to set you apart. The one surest, time-tested and fastest method to build AUM and income is to outperform the S&P 500 with lower risks. Do this and your AUM and income will soar – a fact underscored by industry leaders.
Your Growth and Profitability
- Judge our value by the rate at which your AUM and income grow.
- We will help you and your firm grow and achieve world-class investment results.
Performance Trumps Promotion
Marketing will help you land great clients. However, with great investment performance you will retain your current clients and grow your AUM and income far faster. Your marketing will be far more successful when you demonstrate your investment strategies, based on data science, have significantly outperformed the market.
There are hundreds of technology platforms to help you acquire, serve and communicate with clients.
That’s not us. We make you the hero to your clients by increasing their net worth, period.
Welcome to GrowMyRIA.com, the premier destination for investment professionals seeking to employ objective leading-edge technology to significantly improve their performance and grow their firm. Our technology, InvestLabs™, is powered by Equity Risk Sciences, a trailblazing data science company with a singular mission: to craft investment research of unparalleled value.
Our foundation is built on time-tested data analysis and proven financial models. We are committed to equipping you with proprietary investment ratings that can catapult your firm from ordinary and common to exceptional and exceptionally profitable. At Equity Risk Sciences, we are focused on harnessing the full potential of big data and scientific methods to identify low-risk opportunities for growth and profitability.
Grow My RIA’s subscription service leverages ERS’s Alpha Algorithmics 22™ stock selection system, a tool that powers the same kind of remarkable returns that the largest and most sophisticated investors demand.
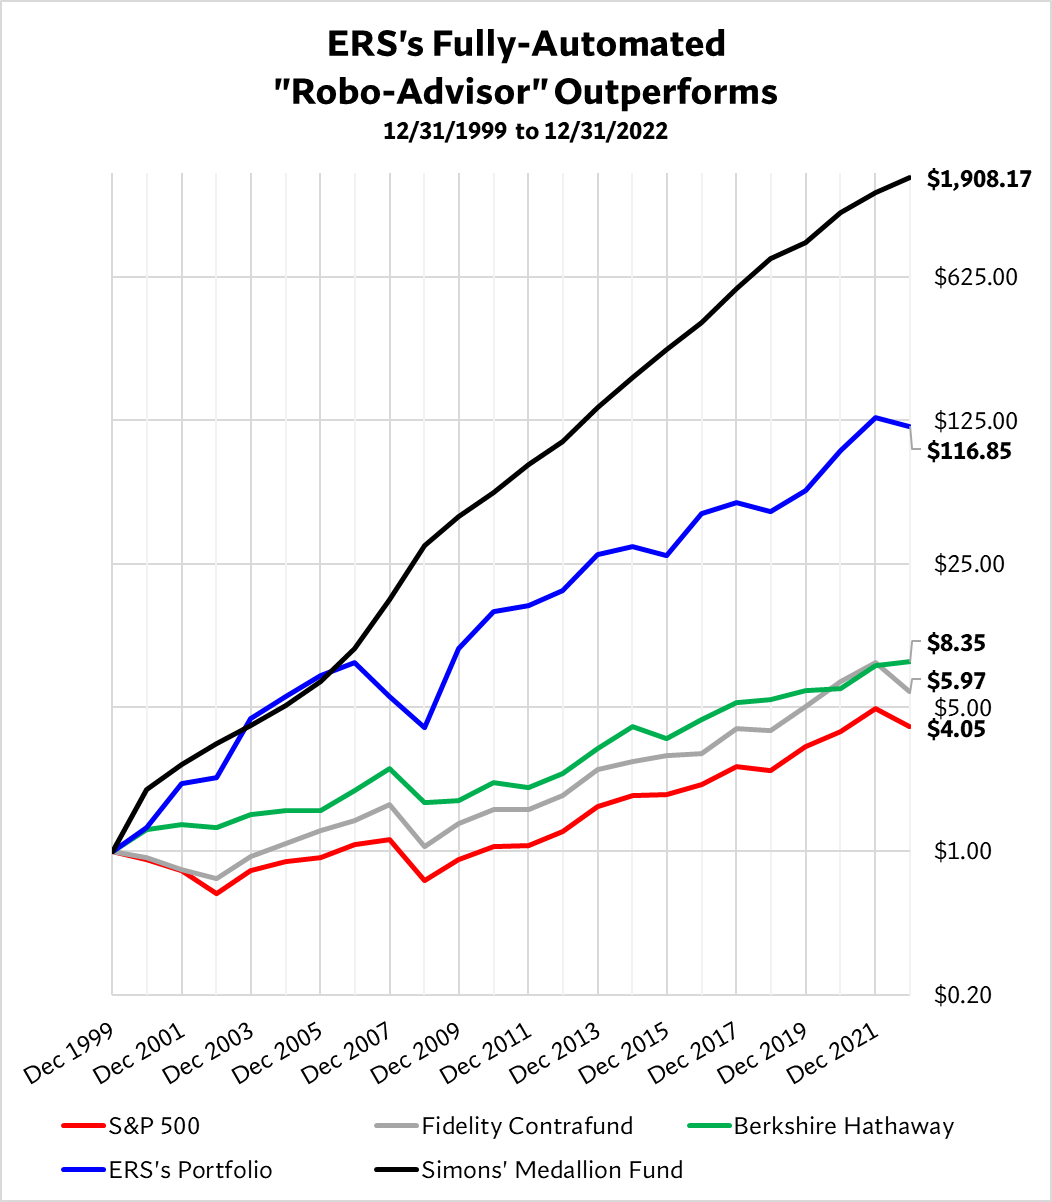
Equity Risk Sciences shares a kindred spirit in the relentless pursuit of extraordinarily high performance with the esteemed Renaissance Technologies, founded by the legendary James Simons, Ph.D. Renaissance, with its cadre of nearly 100 data scientists, has steered the Medallion Fund to a storied position of success through sophisticated algorithms and shrewd data strategies.
Similarly, Equity Risk Sciences employs cutting-edge technology and quantitative analyses to decipher the complexities of the market. As you delve deeper into our site, you’ll uncover more about the impressive performance metrics that set us apart, echoing the triumphs of industry giants like Renaissance Technologies.